



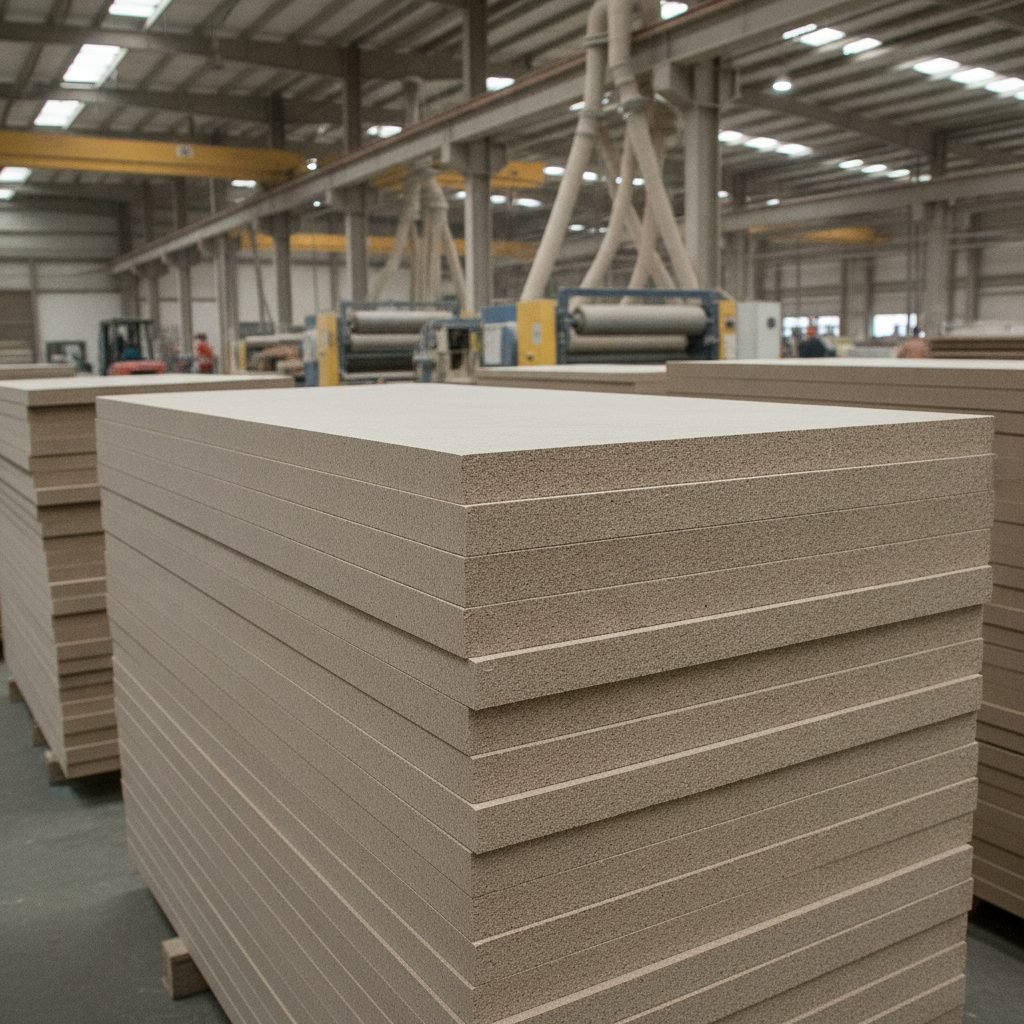


Global MDF trade in 2025 is shaped by a paradox: production capacity hit record levels, yet import prices remain elevated and trade flows are consolidating. China continues to flood export markets, but tariff regimes, shipping constraints, and certification barriers are fragmenting supply chains—leaving buyers in the Americas and Europe paying more for panels despite theoretical oversupply. Here is what the global wood markets data reveals.
Market Snapshot: MDF Trade in 2025
Global MDF production reached 106.8 million cubic meters in 2024, with 2025 projections at 109.2 million m³—a 2.2% increase driven entirely by Southeast Asia and China. However, trade flow imbalances and tariff friction are reshaping buyer sourcing strategies:
- China exports: 18.2 million m³ in 2025 (up 6.3% YoY), valued at $4.1 billion FOB Shanghai. Softwood MDF dominates (~62% of volume), targeting U.S. furniture OEMs and distributors despite 23.8% tariff exposure.
- Southeast Asia (Vietnam, Malaysia, Indonesia): Combined 12.0 million m³ exports; Vietnam alone shipped 5.1M m³, growing at 9.2% YoY as Chinese competitors relocate capacity to avoid tariffs. FOB Bangkok prices: $185–198/m³ (18mm, standard density).
- European exports: Intra-EU trade dominates (~60% of European output). Germany, Poland, and Austria export 4.8 million m³ within the bloc; limited volume reaches North America due to container freight costs ($2,850–3,100 per 40ft) and tariff exposure.
- North American imports: U.S. absorbed 7.8M tons MDF in 2025 (8.4% growth YoY). Canada supplied 3.1M tons domestically produced; China contributed 2.1M tons; Mexico 1.2M tons. Canadian imports face 0% tariff (USMCA), making them the preferred source despite 12–15% price premium vs. Chinese FOB.
- Asia-Pacific internal demand: China’s domestic consumption grew 4.1% YoY to 58.3M m³, reducing net export availability. India imported 2.2M tons, up 18% YoY, driven by furniture manufacturing in Tamil Nadu and Telangana.
- Panel prices trending: European MDF (ex-mill Central Europe, 18mm, E1): €245–268/m³ (Q3 2025); China export FOB: $172–189/m³; North American price (delivered U.S. East Coast): $298–325/m³ due to tariff and freight pass-through.
Deep Analysis: Tariff Regimes and Trade Fragmentation
The Tariff Wall Impact on U.S. Sourcing
The 23.8% combined tariff on Chinese MDF (base 8.5% + Section 301 tariff of 15.3% since September 2018) created a persistent cost disadvantage that has reshaped North American supply chains. In early 2025, a 19mm, medium-density MDF sheet FOB Shanghai cost $0.52/unit; by the time it landed in Los Angeles and cleared customs, the landed cost reached $0.68/unit—a 31% premium. Furniture OEMs and home center chains responded by locking long-term contracts with Canadian mills (Weyerhaeuser, West Fraser) and Mexican producers (Durango operations), despite paying 8–12% premiums over Chinese FOB pricing.
This tariff elasticity has driven substitution and reshoring. Domestic U.S. MDF production (Weyerhaeuser, Medite, Louisiana-Pacific) expanded capacity by 340,000 tons in 2024–25, capturing margin share from imports. Meanwhile, some Chinese exporters relocated lower-labor manufacturing to Vietnam and Cambodia, where tariff classification remains ambiguous and shipping costs to the U.S. West Coast are identical (21–23 days, $2,900–3,150 per container).
EU Internal Trade vs. External Imports
The European MDF market (41.2M m³ domestic consumption, 2025) is almost entirely supplied intra-EU, with tariff-free movement. Major producers—Kronospan, Egger, Pfleiderer, and Sonae—operate 32 mills across Germany, Poland, France, and Portugal, capturing 72% of regional supply. Import tariffs on Chinese MDF are 0%, but non-tariff barriers (EUTR traceability, CARB Phase 2 and its EU equivalent formaldehyde limits, FSC/PEFC certification mandates) effectively price out low-cost Chinese competition. A 18mm Chinese standard-density MDF panel costs €0.36/unit FOB Shanghai; after freight (€0.08/m³), certification testing (€400 per shipment), and EU landed cost, it reaches €0.52–0.56 per unit—parity with EU-produced panels. Consequently, Chinese MDF import share in the EU fell from 8.2% (2020) to 3.1% (2025).
Southeast Asia: Tariff Arbitrage and Export Growth
Vietnam emerged as a critical trade hub in 2025, exploiting tariff gaps. Vietnamese manufacturers (including some relocations from China) exported 5.1M m³, primarily to the U.S. under the assumption that Vietnam-origin goods face lower scrutiny. However, U.S. Customs enforced country-of-origin (COO) rules tightly in Q2 2025, reclassifying 180,000 tons of Vietnamese shipments as Chinese-origin and imposing retroactive tariffs. This enforcement disrupted pricing and forced buyers to demand landed cost certainty. Malaysian and Indonesian producers, with less tariff exposure, grew exports by 7.8% YoY, with Japan and South Korea absorbing increasing volumes (2.3M m³ combined in 2025, up 11.2% YoY).
| Exporter Region | Total Exports (M m³) | YoY Growth % | Primary Destinations | Average FOB Price (USD/m³) | Tariff Exposure* |
|---|---|---|---|---|---|
| China | 18.2 | +6.3% | USA (40%), India (18%), SE Asia (22%) | 178 | USA 23.8%, EU 0%, India 20% |
| Vietnam | 5.1 | +9.2% | USA (68%), Japan (16%), Australia (8%) | 195 | USA 23.8% (if COO verified) |
| Malaysia | 3.8 | +7.8% | Japan (44%), Australia (28%), S. Korea (18%) | 202 | Japan 0%, Australia 0% |
| Indonesia | 3.1 | +8.5% | Japan (51%), India (24%), USA (12%) | 198 | India 20%, Japan 0% |
| Canada | 3.1 | +2.1% | USA (95%), Mexico (3%) | 245 | USA 0% (USMCA) |
| European Union | 4.8 | +1.2% | Intra-EU (85%), UK (8%), Non-EU (7%) | 268 | Intra-EU 0%, UK 2.5% |
*Tariff rates reflect most-favored-nation (MFN) duties and regional trade agreement preferentials; actual rates vary by panel type (Raw MDF vs. Laminated) and end-use classification.
Market Implications: Segmented Buyer Impact
Residential Construction and Home Center Distribution
Home Depot, Lowe’s, and independent lumber distributors faced compressed margins as Chinese import costs rose but retail pricing faced consumer resistance. Inventory turns slowed 8.3% YoY in Q2 2025 as MDF-dependent cabinetry sales softened. Regional price divergence widened: West Coast distributors (closer to Asian ports) paid 6–8% less than East Coast counterparts. Domestic-source preference grew, with major distributors contracting with U.S. mills (Weyerhaeuser’s Longview facility, Louisiana-Pacific) for 18–24 month supply agreements at fixed premiums of 7–9% over Chinese FOB—a hedging strategy that locked in margin even if tariffs fell.
Outlook and Buyer Recommendations
Price Direction (Q4 2025 – Q2 2026)
MDF prices are expected to remain elevated through Q1 2026, supported by tight container availability (post-Suez delays extending vessel cycles by 4–6 weeks) and Chinese New Year production slowdowns (typically February–March). FOB Shanghai prices should stabilize at $185–195/m³ for standard density (17–19mm), with downside risk if Chinese domestic demand weakens. North American pricing likely remains 15–18% above Chinese FOB, sustained by tariff lock-in and USMCA premium sourcing. European prices should inch lower (+0% to –2% QoQ) as Q4 demand seasonality softens and Polish/German mill capacity comes online.
Risk Scenarios
Upside Risk (prices +8–12%): New U.S. tariff escalation targeting Vietnam and Cambodia sourcing could reclassify an additional 800,000–1.2M tons of imports as Chinese-origin, triggering retroactive duties and panic-buying ahead of enforcement. A broader U.S.–China trade framework collapse would broaden tariff scope to raw MDF (currently dutiable at 8.5%) and particleboard, compressing margins further.
Downside Risk (prices –6–10%): Recession-driven furniture and construction slowdown in Q4 2025 could deflate demand 5–8%, forcing Chinese mills to discount exports aggressively to maintain volume. Chinese domestic consumption is already cooling (property sector weakness), making excess capacity available for export dumping. European energy prices falling below €75/MWh would trigger European mill pricing pressure, creating global floor competition.
Buyer Recommendations
- Lock forward contracts now for Q1–Q2 2026 delivery. Use 60–90 day lead times to negotiate fixed pricing with Canadian, Mexican, or EU suppliers to hedge tariff reclassification risk and container freight volatility. Avoid spot market exposure in Jan–Mar when Chinese supply floods after CNY.
- Diversify suppliers across tariff regimes. Allocate 50% sourcing to USMCA-compliant (Canada, Mexico) or EU-origin panels; 30% to Southeast Asia with verified COO documentation; and retain only 20% Chinese exposure for price flexibility. This mix balances cost and tariff predictability.
- Prioritize CARB Phase 2 and FSC/PEFC certification early. Suppliers without third-party certification face delayed shipments and rework costs. Lock in certified suppliers now; premium (5–8%) is recoverable through retail or OEM pricing justified by compliance certainty.
- Monitor Vietnam tariff enforcement weekly. U.S. Customs is actively reclassifying Vietnamese imports. Subscribe to USTR and CBP notices; request importers and freight forwarders provide COO affidavits and supply chain transparency to avoid retroactive tariff bills.
- Build 4–6 week safety stock for Q1 2026 delivery. Container freight volatility and port congestion (LA/Long Beach backlogs typical in Jan–Feb) justify inventory buildup in Q4 2025, locking in current pricing before potential January tariff announcements.
MDF trade in 2025 is no longer a commodity story—it is a supply chain fragmentation story. Tariffs have splintered global sourcing, certification barriers have compressed competitor pools, and shipping constraints have widened regional price gaps. Buyers who diversify suppliers across tariff regimes, lock forward commitments, and prioritize certification compliance will secure cost stability; those relying on Chinese spot purchases or delayed sourcing decisions will face margin compression and supply risk. For live data and timber prices benchmarks, visit our industry reports tracker on TimberInsider.
Frequently Asked Questions
Which countries dominate MDF exports in 2025?
China remains the largest MDF exporter globally, shipping 18.2 million cubic meters in 2025—up 6.3% YoY. Vietnam, Malaysia, and Indonesia collectively account for 12 million m³ of Southeast Asian supply. European manufacturers (Germany, Poland) export 4.8 million m³ primarily within the EU and to North America.
What is the current tariff environment for MDF imports?
U.S. duties on Chinese MDF average 23.8% (base + Section 301 tariff), effective since 2018. EU tariffs remain at 0% for intra-bloc trade. India imposes 20% import duty on finished MDF panels. Tariff volatility is a key cost driver for importers.
How much MDF is the U.S. importing annually?
U.S. MDF imports totaled 7.2 million metric tons in 2024 and are tracking at 7.8 million tons in 2025, primarily from Canada (3.1M tons), China (2.1M tons), and Mexico (1.2M tons). Domestic production covers ~40% of U.S. demand.
Why are MDF prices rising despite high supply?
China and Southeast Asian producers are prioritizing domestic consumption and export premiums to higher-margin markets (U.S., EU). Tight shipping capacity, elevated energy costs (€85–110/MWh in Europe), and tariff pass-through drive retail prices up 8–12% YoY despite surplus capacity.
What regulatory changes affect MDF trade in 2025?
EU’s updated EUTR (timber legality) requirements tightened traceability for imported panels; Indonesia faces heightened verification. U.S. CARB Phase 2 formaldehyde limits (0.11 ppm) now exclude most Asian low-cost producers unless certified. FSC and PEFC certification premiums range 5–15% depending on destination market.
Update policy and background sources
This page was editorially reviewed on 13 July 2026. Dated prices and market shares are reference-period observations, not live quotations. Buyers should confirm specification, Incoterm, currency, tax, freight and quote validity before using a number commercially. Background statistics and standards for this subject are published by:
- FAOSTAT Forestry Production and Trade
- UN Comtrade
- Eurostat international trade in goods
- UNECE forest-products markets
TimberInsider separates observed data from estimates and does not treat a supplier list as certification or endorsement. See the editorial methodology, product guides and regional coverage for definitions and current context.


