



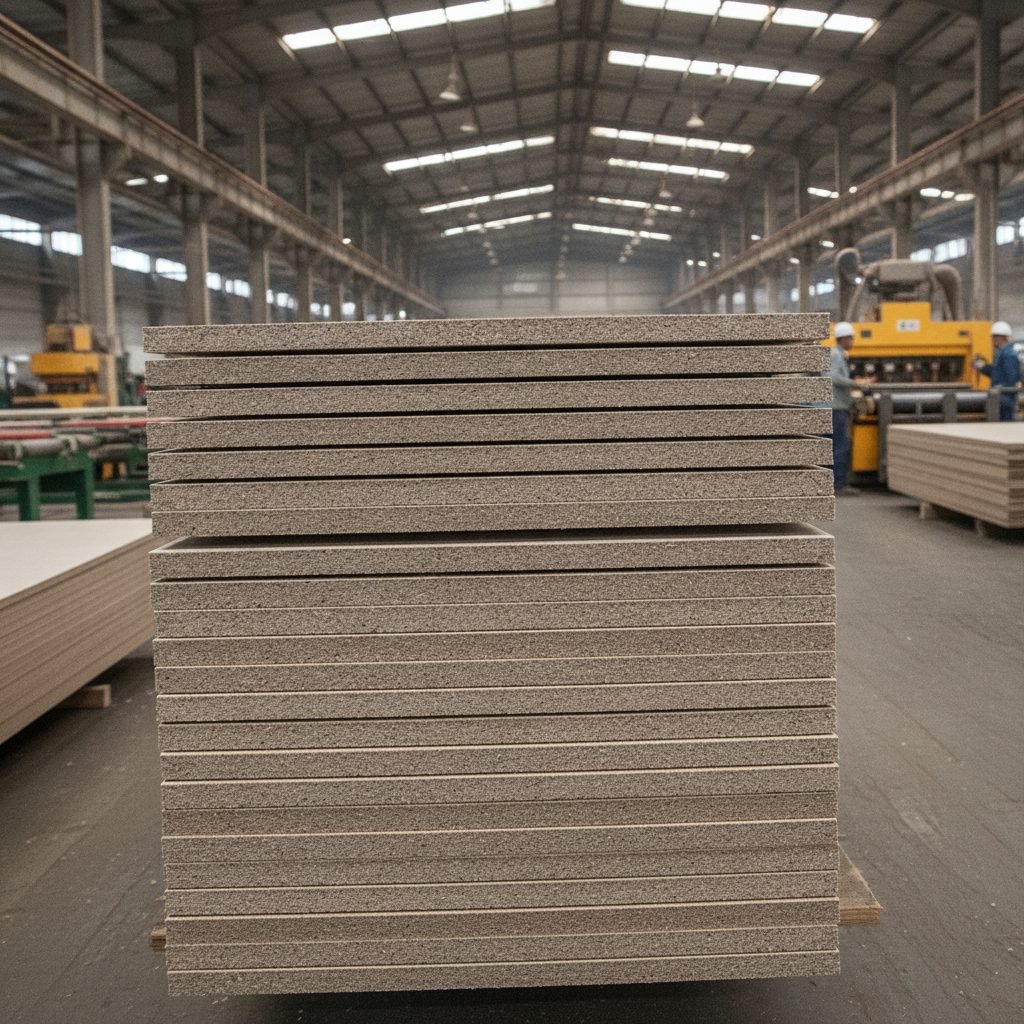


India’s MDF export volume jumped 28% year-over-year in Q1 2025, reaching 387,000 cubic metres—the highest quarterly shipment since 2019. Yet average FOB prices fell to $312/m³, down 11% from Q4 2024, as regional overcapacity and rising Chinese competition reshape global wood markets.
For Indian panel producers, the paradox is clear: scale gains collide with margin compression. This report maps the export surge, identifies which buyer segments benefit most, and projects where India’s MDF pricing settles through year-end.
Market Snapshot
Export Volume & Pricing: India shipped 387,000 m³ of MDF in Q1 2025 (vs. 302,000 m³ in Q1 2024), according to preliminary Indian Bureau of Mines and directorate of foreign trade data. FOB prices averaged $312/m³, down from $350/m³ in Q4 2024 and $380/m³ in Q1 2024. Moisture-resistant grades (MR-MDF) traded at a $25–30/m³ premium, while fire-rated variants commanded $40–50/m³ above commodity 2.4mm standards.
Producer activity: Indian capacity commissioned in late 2024 lifted export shipments, while smaller producers reported flat-to-declining overseas volumes under margin pressure. Brazilian and Chilean producers held European market share but met stronger Indian competition in Middle Eastern and African markets. Shipment volumes are not published per company, so treat any per-producer figure as an estimate.
Regional Pricing & Trade Flows: Southeast Asia (Vietnam, Thailand, Indonesia) absorbed 42% of Indian MDF exports at $305–315/m³. Middle East and Africa combined took 31% at $320–330/m³. Europe imported only 12% of Indian MDF (vs. 18% three years ago), as Central European production remains competitive on lead time and finish quality. Panel prices in Vietnam’s domestic market fell 6% QoQ partly due to Indian import pressure.
Supply-Side Drivers: Domestic eucalyptus fiber availability in Karnataka and Tamil Nadu hit record levels. Fuel costs (imported coal, natural gas) averaged 34% of production cost in Q1 2025, steady YoY. Export credit guarantee agencies (ECGC) reported healthy demand for short-term shipment insurance, suggesting buyer confidence in Indian supply reliability.
| Metric | Q1 2024 | Q1 2025 | YoY Change |
|---|---|---|---|
| Total Export Volume (m³) | 302,000 | 387,000 | +28.1% |
| Average FOB Price ($/m³) | $380 | $312 | –17.9% |
| Top Destination Share: Southeast Asia (%) | 38% | 42% | +4 pts |
| European Market Share (%) | 18% | 12% | –6 pts |
| MR-Grade Premium ($/m³) | $28 | $26 | –$2 |
Deep Analysis
Capacity Expansion & Fiber Supply Momentum
India’s installed MDF capacity grew to 3.2 million tonnes annually at end of Q1 2025, up from 2.9 million tonnes in early 2024. Greenpanel’s 400,000-tonne mill near Visakhapatnam and Century Ply’s 320,000-tonne facility in Jharkhand both reached steady-state production by March 2025. Eucalyptus fiber sourcing—primarily from managed plantations in Andhra Pradesh, Telangana, and Tamil Nadu—remained abundant and price-stable at INR 4,500–5,200/tonne ($54–62/tonne at current FX rates).
This fiber glut is structural, not cyclical. India’s forest department reported 2.1 million hectares of planted eucalyptus in 2024, with harvest cycles accelerating to 7–8 years from historical 9–10 years. Simultaneously, Indian plywood and particleboard mills face margin pressure, so they are not competing aggressively for fiber. Result: MDF producers enjoy raw-material tailwinds that translate directly into export competitiveness rather than margin expansion.
Regional Price Divergence & Chinese Displacement
India’s pricing advantage is sharpest in Southeast Asia and Africa, where logistics costs from Chinese mills (Shandong, Jiangsu) and lead times (35–45 days) create an opening for Indian FOB shipments (typically 14–21 days to Bangkok, Ho Chi Minh City). Vietnamese furniture OEMs are shifting 18–22% of MDF inbound volume from domestic mills to Indian importers at price points $15–20/m³ below local production.
Europe remains inaccessible at these price levels. German distributors still price Central European MDF at €350–380/m³ (approximately $380–415/m³ delivered Germany), a 20–25% premium over Indian FOB. However, finish quality, moisture uniformity, and on-time delivery remain superior for Central European producers—a moat that pricing alone cannot erode. Indian mills are responding by investing in veneer-faced MDF (white melamine overlay) to capture mid-tier European DIY and cabinet segments, but volumes remain below 5% of total exports.
Trade Policy & Tariff Backdrop
India’s MDF exports benefit from zero applied tariffs into ASEAN and preferential rates under India-Thailand and India-Vietnam FTAs (5–10% in most categories). Middle East purchases face no significant duties. However, Egypt and Nigeria have signaled interest in raising MDF import tariffs to protect nascent domestic capacity (Egyptian mills Domyati and Helwan Plywood; Nigerian capacity largely idle). If tariffs reach 15–20%, Indian export economics to North Africa would compress significantly, potentially redirecting 40,000–50,000 m³ annually to Southeast Asia and further depressing regional pricing.
Domestically, India maintains a 10% export duty on logs and a 5% duty on processed wood products (timber, veneer), which does not directly apply to MDF. However, the government’s push to encourage value-added exports (e.g., finished furniture versus raw panels) could introduce indirect policy headwinds—subsidized domestic credit for downstream processors, for instance—that would reduce MDF export incentive over a 18–24 month horizon.
Market Implications
Impact by Buyer Segment
Segment 1: Southeast Asian Furniture & Cabinet OEMs. Indian MDF imports are a structural cost lever. A Vietnamese cabinet manufacturer buying 8,000 m³/quarter saves approximately $140,000–180,000 in raw materials by switching 40% of volume from domestic to Indian sources. This benefit cascades into retail pricing and OEM margin recovery—a tangible competitive advantage in a market where labor costs are converging and land rent is rising. However, this segment is price-takers; any further price decline from Chinese capacity restarts or Indian mill destocking would shift 10–15% of volume back to spot buys from Chinese traders, creating volatility.
Segment 2: Middle East & North Africa Panel Distributors. Importers in UAE, Saudi Arabia, and Egypt are building inventory at Indian prices, betting that Q2–Q3 demand from construction and furniture will exceed supply and lift prices. Early 2025 orders locked in April-May shipments at $315–318/m³; if prices hold or rise, margin capture is real. If Chinese competition or domestic North African production accelerates, these distributors face 6–9 months of negative margin on stored inventory, forcing mark-downs.
Segment 3: European Resellers & Veneer-Faced Panel Buyers. Indian veneer-faced MDF (white melamine, oak, walnut finishes) is gaining traction in German, Polish, and UK distribution. Buyers perceive a price advantage versus Central European panels without sacrificing appearance. However, glue-line durability and sanding flatness still lag premium European grades. Sapele and teak-faced Indian MDF remain thin in supply; volumes are below 2,000 m³/month Europe-wide. This segment is growth-oriented but represents less than 4% of Indian MDF export value.
Regional Price Divergence Drivers
Southeast Asia: Oversupply of Indian MDF relative to local production capacity has compressed regional pricing. Vietnamese and Thai mills are cutting shifts and reducing active capacity to 75–80% utilization in response. This is the price floor for Indian exports; further declines would trigger mill shutdowns in the region, reallocating demand back to Indian and Chinese sources. Expect $305–320/m³ FOB India in Q2 2025 for commodity grades.
Middle East & Africa: Less oversupplied than Southeast Asia. Local distribution is fragmented; import tariffs remain moderate. Indian MDF occupies a sweet spot: cheaper than European brands, more reliable than Chinese traders. Pricing is likely to hold $320–335/m³ FOB through Q3 2025, barring Egyptian or Nigerian tariff shocks. This region is the highest-margin export destination for Indian mills.
Europe: Premium positioning persists. Indian commodity MDF will not compete on price. Veneer-faced and specialty grades (fire-rated, moisture-resistant) are the entry vector. The Central European premium likely persists through 2025, supported by certification (FSC/PEFC) depth, technical support, and finish consistency. Indian mills pursuing Europe must invest in compliance and branding; opportunistic price-cutting will not open doors.
Outlook & Buyer Recommendations
Price Direction & Key Driver
India’s MDF FOB prices are forecast to trade in a $305–330/m³ band through Q3 2025, with downside risk to $295/m³ if Chinese mill utilization jumps above 85% and inventory destocking accelerates. The primary driver is seasonal furniture demand in Southeast Asia and the Middle East. Q2 typically sees strong buying (spring/summer furniture cycles); Q3 demand often softens ahead of Q4 retail inventory buildup. If Q2 demand matches or exceeds Q1 levels, prices will find support at $320/m³. If Q2 disappoints, expect a slide to $310–315/m³ and inventory build at Indian ports.
Risk Scenarios
Upside Scenario (Probability: 25%): Chinese coal and natural gas prices spike due to supply disruptions, raising production costs in Shandong mills by $18–25/m³. Simultaneously, Indian mill capacity tightens due to planned maintenance (Q2 often sees 3–4 week shutdowns) and fiber supply constraints emerge post-monsoon. Result: Indian FOB prices rally to $335–350/m³ by August 2025, attracting hedging demand from European distributors and Middle East importers. Margin recovery is real for Indian producers.
Downside Scenario (Probability: 30%): Chinese mills idle in 2024–2025 come back online at 70%+ utilization rates, dumping inventory into Southeast Asia and Africa. Simultaneously, Egyptian capacity additions (Domyati Phase 2) add 150,000 tonnes/year of local supply, depressing North African import demand. Indian MDF FOB prices collapse to $290/m³ or below by Q3 2025. Smaller Indian producers would face margin compression and possible capacity reductions, while larger players would absorb losses and cut export volumes to preserve working capital.
Buyer Recommendations
- Lock in 6–8 month forward contracts now (April–May 2025) at $310–320/m³ FOB India. This hedge captures the seasonal upside from Q2 demand while capping downside to the range. Avoid spot buying in June–July, when summer demand typically softens and prices often test lows.
- Shift 25–35% of inbound volume to Indian suppliers if you are currently buying from Vietnamese or Thai mills. Cost savings are real and durable; supply reliability is proven. This is especially valuable for Southeast Asian and Middle East buyers facing pressure from retail competition.
- For European buyers, evaluate veneer-faced Indian MDF (white melamine, oak) as a secondary source. Quality parity with Central European panels is now achievable, and the discount is real. Start with a 500–1,000 m³ pilot order to validate sanding, glue-line durability, and delivery consistency.
- Monitor Egyptian tariff deliberations closely. If MDF import tariffs are raised to 15%+, pivot 40,000–50,000 m³ of North Africa-bound volume to Southeast Asia, further depressing regional pricing. Pre-position inventory or forward contracts accordingly.
- Avoid opportunistic spot buying from Indian traders in July–August. Seasonal demand softness often triggers margin-desperate price cuts; these are traps for buyers who lack visibility into mill economics and inventory levels.
Closing Perspective
India’s MDF export surge in 2025 is a story of structural capacity expansion meeting price compression—a classic commodities cycle. Domestic fiber abundance and production scale give Indian mills a durable cost advantage in price-sensitive markets (Southeast Asia, Africa, Middle East), but that advantage manifests as export volume growth, not margin expansion. Buyers benefit tangibly from competitive pricing, but should lock in medium-term contracts to hedge against both upside (Chinese mill restarts) and downside (seasonal demand softness) volatility. European and premium segments remain defended by brand, service, and certification depth—Indian mills have not yet cracked that code, nor do Q1 2025 data suggest imminent breakthrough. The next 6–9 months will reveal whether Indian producers can stabilize pricing through inventory discipline or whether margin pressure forces consolidation. For live data and price benchmarks, visit our asia tracker on TimberInsider.
Frequently Asked Questions
Why are India’s MDF export prices falling in 2025 despite higher volume?
India’s MDF capacity expanded 10% in late 2024 (Greenpanel, Century Ply mills came online), increasing supply faster than global demand growth. Simultaneously, Chinese mills are gradually restarting idle capacity, intensifying price competition in price-sensitive markets like Southeast Asia and Africa. Domestic fiber supply is abundant, so cost floors are lower for Indian mills than for competitors. The result: volume growth comes at the expense of per-unit margins.
Which regions are the most profitable destinations for Indian MDF exports?
Middle East and North Africa offer the highest margins ($320–335/m³ FOB), as local competition is fragmented and tariffs remain moderate. Southeast Asia (Vietnam, Thailand) is high-volume but lower-margin ($305–315/m³), due to regional oversupply and competition from domestic mills. Europe is inaccessible at commodity prices but offers niche opportunities in veneer-faced grades (12–15% price premium over Indian commodity MDF is still achievable).
What is the biggest downside risk to Indian MDF export pricing in the next 6 months?
Chinese mill restarts at high utilization rates (70%+) coupled with seasonal demand softness in Q3 2025 (post-monsoon) could drive Indian FOB prices below $300/m³. Additionally, Egyptian and Nigerian tariff increases on imported MDF would redirect 40,000–50,000 m³ annually away from North Africa into oversupplied Southeast Asian markets, further compressing regional pricing. A confluence of these factors could force margin pressure on smaller Indian producers.
Is Indian MDF gaining share in Europe, and at what price point?
Indian MDF represents only 12% of European imports, down from 18% three years ago. European buyers prefer premium Central European grades for finish, certification depth (FSC/PEFC) and on-time delivery. Indian MDF is entering via veneer-faced specialty grades at a discount, but volumes remain below 5% of total Indian exports. A breakthrough would require Indian mills to invest in certification and branding, not just price.
Should my furniture OEM or distributor lock in forward contracts for Indian MDF now, or wait for lower prices?
Lock in 6–8 month forward contracts at current levels ($310–320/m³ FOB) to hedge seasonal volatility. Q2 demand is typically strong (spring/summer furniture cycles), creating upside price risk. Waiting for lower prices in Q3 is speculative; if Chinese competition or domestic destocking accelerates, spot prices could fall, but the timing and magnitude are uncertain. A forward contract protects margin while allowing inventory deployment aligned with demand.
Update policy and background sources
This page was editorially reviewed on 13 July 2026. Dated prices and market shares are reference-period observations, not live quotations. Buyers should confirm specification, Incoterm, currency, tax, freight and quote validity before using a number commercially. Background statistics and standards for this subject are published by:
- FAOSTAT Forestry Production and Trade
- UN Comtrade
- Eurostat international trade in goods
- UNECE forest-products markets
TimberInsider separates observed data from estimates and does not treat a supplier list as certification or endorsement. See the editorial methodology, product guides and regional coverage for definitions and current context.


